Confidence Intervals Explained: Statistical Inference for Data Science and ML

Introduction to Statistical Inference:
Statistical inference is a foundational element of data analysis, guiding decision-making processes across diverse fields such as healthcare, finance, and social sciences. In this comprehensive guide, we will explore the crucial concept of confidence intervals, a vital tool in statistical inference that helps quantify uncertainty in our estimates of population parameters. Whether you are a seasoned data analyst or a novice in the realm of statistics, understanding how to effectively use confidence intervals will empower you to make data-driven decisions with confidence.
What is Statistical Inference?
Before delving into confidence intervals, it's crucial to grasp the essence of statistical inference. At its core, statistical inference involves drawing conclusions about a population based on a sample drawn from it. This process entails making estimations, testing hypotheses, and deriving insights with a certain degree of uncertainty. Statistical inference is like a bridge that connects raw data to meaningful conclusions, turning numbers into actionable insights.

The Power of Confidence Intervals in Data Analysis
Confidence intervals serve as the cornerstone of statistical inference, providing a range of values within which we can reasonably expect a population parameter to lie. These powerful tools allow researchers and analysts to express the reliability of their estimates, making them indispensable in fields that rely on quantitative analysis.
Deep Dive into Confidence Intervals
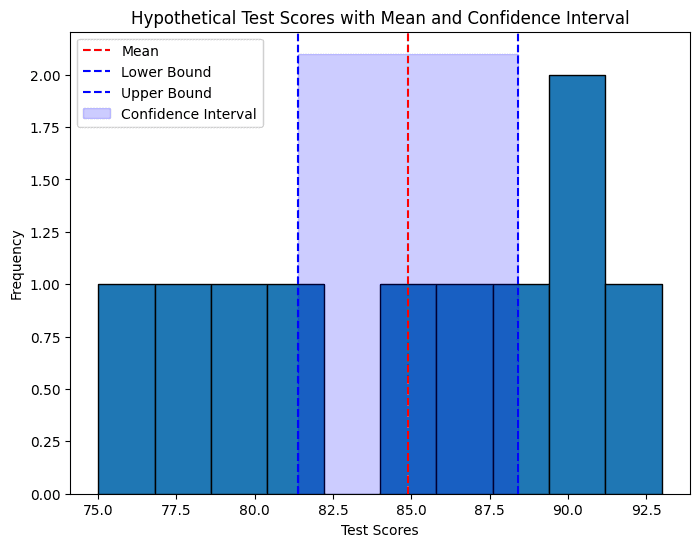
Confidence intervals help quantify uncertainty, allowing analysts to make informed decisions based on sample data. For example, consider assessing the effectiveness of a new teaching method by measuring the test scores of a sample of students. Here, the average test score (X) serves as our point estimate of the population mean, while the population standard deviation (σ) indicates variability.

Constructing Confidence Intervals: Step-by-Step
To construct a confidence interval, we begin by calculating the standard error of the mean (σX), which represents the margin of error in our estimate. This is achieved by dividing the population standard deviation (σ) by the square root of the sample size (n).
The confidence interval formula can be expressed as:
CI = X ± Z (σ/√n)
Where:
CI represents the confidence interval,
X is the sample mean,
Z is the critical value from the standard normal distribution corresponding to the desired confidence level,
σ is the population standard deviation, and
n is the sample size.
Interpreting Confidence Intervals for Informed Decision-Making
The resulting confidence interval provides a range of values within which we can be confident, at the specified level, that the true population parameter lies. For instance, a 95% confidence interval implies that if we were to repeat the sampling process numerous times, 95% of these intervals would contain the true population parameter. Understanding how to interpret confidence intervals is essential for making informed decisions in data analysis.

Real-World Applications of Confidence Intervals
Confidence intervals find widespread application across diverse domains, including:
Healthcare: Estimating the effectiveness of treatments and interventions, guiding clinical decision-making.
Finance: Estimating expected returns on investments and assessing risks associated with financial assets.
Social Sciences: Evaluating the impact of educational programs and measuring public opinion through surveys.
Common Challenges in Using Confidence Intervals
While confidence intervals offer invaluable insights, it's essential to recognize their limitations and potential pitfalls. Factors such as sample representativeness, assumptions of statistical tests, and the presence of outliers can influence the accuracy and reliability of confidence intervals.

Best Practices for Effective Confidence Interval Analysis
To leverage confidence intervals effectively, practitioners should adhere to best practices and guidelines:
Conduct Robust Sample Size Calculations: Ensure that your sample size is adequate to provide reliable estimates.
Validate Assumptions: Check that the assumptions underlying your statistical tests are met.
Employ Appropriate Statistical Techniques: Use the correct statistical methods for your data analysis.
Beware of Outliers: Identify and address outliers that can skew your results.
Use Software Effectively: Utilize statistical software to perform accurate calculations and visualizations.
Common Mistakes to Avoid
Ignoring Sample Size: Small samples can lead to wide confidence intervals, reducing the precision of your estimates.
Misinterpreting Confidence Levels: A 95% confidence interval doesn't mean there's a 95% chance the true parameter is within the interval. It means that 95% of such intervals would include the true parameter if we repeated the sampling process many times.
Overlooking Assumptions: Failing to validate assumptions can compromise the validity of your confidence intervals.

Conclusion
In the realm of statistical inference, confidence intervals stand as one of the most trusted methods for deriving insights from data. By mastering how to construct, interpret, and apply confidence intervals, data analysts, researchers, and decision-makers can quantify the uncertainty of estimates, making well-informed conclusions with a defined level of precision. Confidence intervals are not just about measuring certainty—they empower us to assess the range within which true population parameters likely fall, turning data analysis into a more meaningful, actionable endeavor.
As essential as confidence intervals are, data science often requires a flexible approach when dealing with evolving information or complex scenarios. This is where Bayesian Statistics steps in, offering a probabilistic framework to refine predictions as new data emerges. Unlike traditional approaches, Bayesian inference allows us to update initial assumptions with real-time evidence, making it particularly powerful for applications like predictive modeling, diagnostics, and data-driven decision-making.
In our next blog, we’ll dive into Bayesian statistics and sampling distributions, examining how Bayesian methods bring a dynamic edge to inference by continually adjusting probabilities as new evidence arises. With Bayesian approaches, you’ll see how data analysis becomes an adaptable and responsive process, offering insights that evolve alongside the data itself. Embrace this journey from confidence intervals to Bayesian inference to build a robust foundation in data science—an approach that’s essential for anyone serious about mastering predictive analytics, machine learning, and decision science.

Ready to unlock the adaptive world of Bayesian statistics? Keep reading, and let’s take your understanding of statistical inference to a new level.
Subscribe to unlock the mysteries of data science! Share with fellow explorers and drop a comment—let's dive deeper into data wonders together!