Essential Statistics for Data Analysis: Master Mean, Median, Variance & Probability

Introduction:
Statistics is the core foundation of data analysis, empowering analysts to transform raw data into meaningful insights. In this comprehensive guide, we’ll explore essential statistical concepts such as mean, median, variance, and probability, all of which are fundamental for data analysts, data scientists, and business intelligence professionals. By mastering these statistics basics, you'll be equipped to uncover patterns, make data-driven decisions, and interpret complex datasets. Whether you’re a beginner eager to learn or a seasoned professional looking to refresh your skills, this guide provides both introductory explanations and practical applications.
Understanding Basic Statistics
Statistics, often described as the “language of data,” encompasses the science of data collection, analysis, interpretation, and presentation. For data analysts and scientists, a strong grasp of basic statistics is essential for data exploration, pattern recognition, and hypothesis testing, and to build machine learning models. By understanding core statistical principles, professionals can derive actionable insights and predict outcomes more accurately, contributing directly to data-driven decision-making.

Measures of Central Tendency
Measures of central tendency are the backbone of data interpretation. They help in summarizing data by identifying a central or typical value around which other values in the dataset cluster. The three main measures—mean, median, and mode—each offer unique insights, and understanding when to use each is critical in both simple and complex analyses.

Mean (Average)
The mean, or average, is one of the most widely used statistics. It’s calculated by adding all values in a dataset and dividing by the number of values. The mean is most effective for normally distributed data without significant outliers, as it can be skewed by extreme values.
Formula:
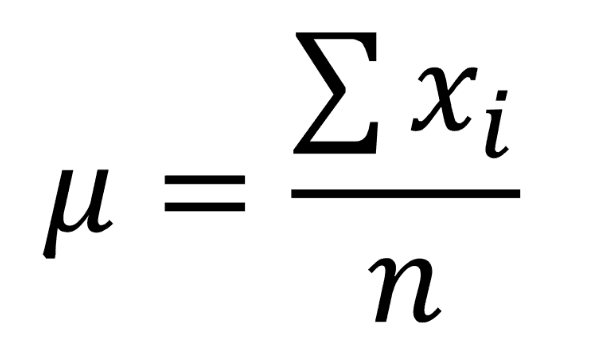
Where X is each value in the dataset, and N is the total number of observations.
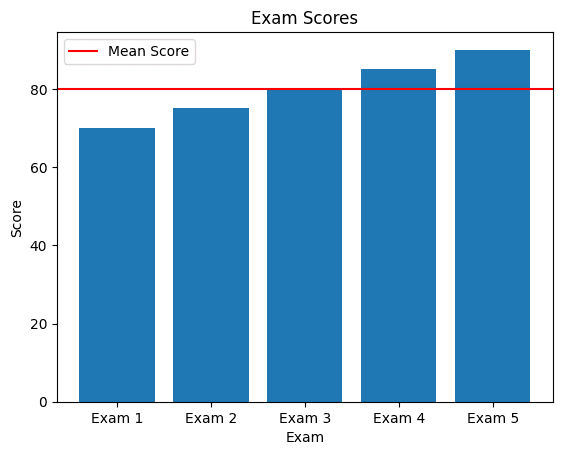
Example: Suppose we have a dataset of exam scores: 70, 75, 80, 85, and 90. Here, the mean is:
70+75+80+85+90 / 5 =80
Usage in Data Science:
Mean values are often used in finance to determine average returns, in healthcare to calculate average patient scores, and in customer analytics to find average purchase values.
Median
The median is the middle value in an ordered dataset and is particularly useful in skewed data distributions, where it provides a more accurate measure of central tendency than the mean. Unlike the mean, the median is unaffected by extreme outliers, making it valuable in datasets with a high degree of variability.
Example:
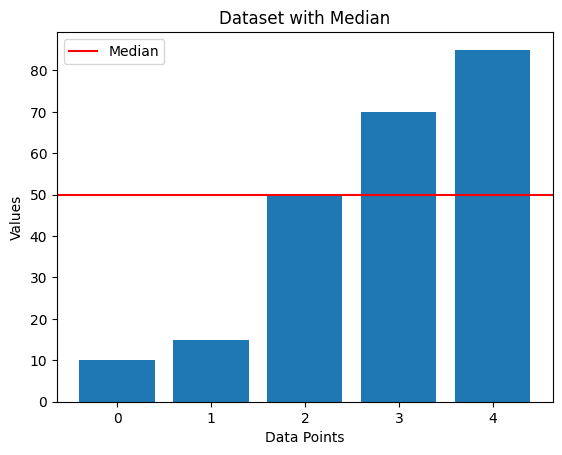
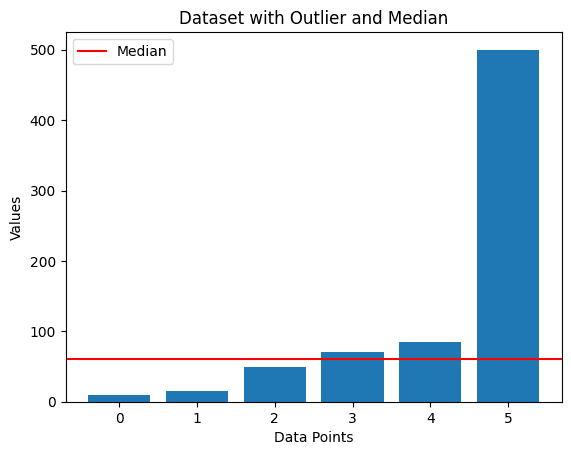
For the dataset (10, 15, 50, 70, 85), the median is 50. If we add an outlier like 500, the median remains 50, while the mean increases significantly.
Depiction of Median WITHOUT Outlier:
Depiction of Median WITH Outlier:
Real-World Application:
The median is often used in reporting household incomes or property values to avoid skewed data by high-value properties or incomes, providing a clearer picture of the typical value.
Mode
The mode is the most frequently occurring value in a dataset and is most applicable in categorical data, where we want to find the most common category or characteristic.
Example: For a survey of favorite colors (blue, red, blue, green, blue), the mode is "blue," as it appears most frequently.
Measures of Dispersion
Measures of dispersion show the spread or variability within a dataset. While central tendency measures provide a typical value, dispersion measures like variance and standard deviation tell us how much values differ from that typical value. They are essential for assessing consistency, identifying outliers, and evaluating risk.

Variance
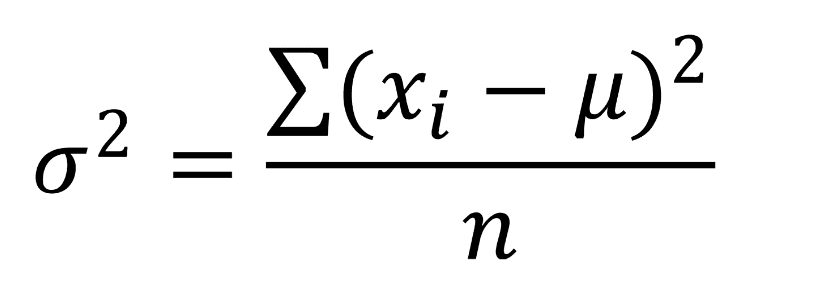
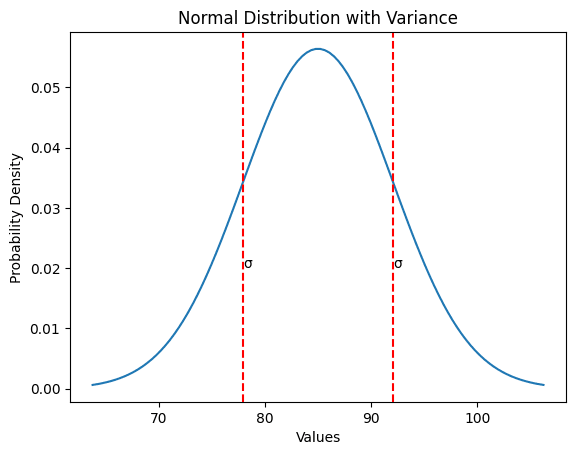
Variance quantifies the average squared difference from the mean, offering insights into how much individual data points deviate from the mean. A high variance indicates that data points are widely spread around the mean, while low variance suggests that they are close to the mean.
Formula:
Example:
Using the exam scores dataset (80, 85, 90, 75, 95), we find the mean and then calculate the squared deviations from this mean to find variance.
Usage:
Variance is essential in finance to measure the volatility of asset returns, in manufacturing to assess product consistency, and in healthcare to evaluate variability in treatment outcomes.
Standard Deviation
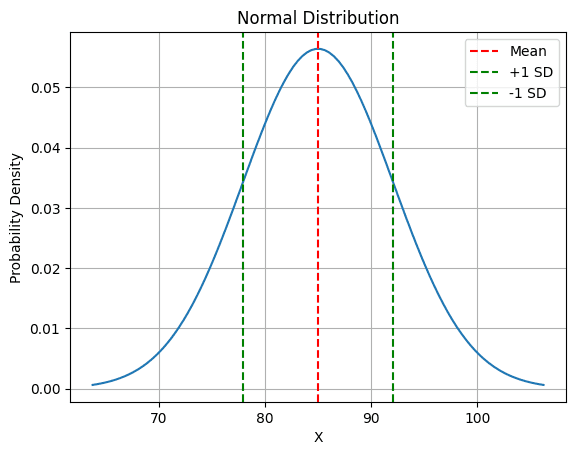
The standard deviation, derived from the square root of the variance, measures the average deviation from the mean in the same units as the data. It provides a more intuitive understanding of data dispersion and is widely used in data analysis for assessing volatility and consistency.
Formula:
Standard Deviation = sqrt of Variance
Practical Applications in Data Analysis
Customer Segmentation: Using measures of central tendency, businesses can identify typical customer behaviors and create targeted marketing campaigns.
Risk Assessment in Finance: Standard deviation and variance are used to evaluate the risk in investment portfolios, with higher values indicating greater volatility.
Quality Control in Manufacturing: Standard deviation helps monitor product consistency, as low standard deviations indicate reliable quality.
Healthcare Analytics: Probability and statistics are used to analyze clinical trial data, helping to make informed decisions about treatments and patient care.
What’s Next: Probability and Normal Distribution in Data Analysis
As we’ve explored the fundamentals of central tendency and dispersion, our next blog will dive into the realms of Probability and Normal Distribution—two crucial concepts in data science that allow analysts to make predictions and understand the natural variability within datasets. Probability forms the basis of inferential statistics and predictive analytics, while the normal distribution helps us understand data that clusters around a central value, often called the "bell curve."
In our upcoming blog, we’ll cover:
Probability Basics: Understand how likelihood is quantified and applied in data-driven decision-making.
Normal Distribution Essentials: Explore the characteristics of the normal distribution and why it’s foundational in statistical analysis and machine learning.
Stay tuned as we unravel these concepts in-depth, complete with examples and practical applications that highlight their importance in data science and analytics.
FAQs on Basic Statistics
What is the difference between variance and standard deviation?
Variance measures dispersion in squared units, while standard deviation represents dispersion in the same units as the data.
When should I use the median over the mean?
Use the median for skewed data or data with outliers, as it provides a better representation of central tendency in such cases.Why is probability important in machine learning?
Probability helps in predictive modeling, such as determining the likelihood of different outcomes in classification models.
Further Learning Resources
Books:
"Naked Statistics" by Charles Wheelan – A reader-friendly introduction to statistics.
"Practical Statistics for Data Scientists" by Peter Bruce – Focused on data science applications.
Online Courses:
Practice Datasets:
Kaggle – Access free resources and datasets to practice.
Stay Connected!
We’d love to hear from you! Drop your questions, insights, or data science stories in the comments, and don’t hesitate to reach out at info@thedatacell.com. Let’s turn this blog into a vibrant community of data explorers where curiosity fuels growth.
Join our mailing list below to keep up with the latest posts, exclusive insights, and more. Your data adventure is just getting started, and we’re excited to be part of it with you!