Identifying Data Patterns: Correlation and Regression Analysis for Machine Learning

Introduction
In our previous blog, we tackled the basics of probability and hypothesis testing to lay a solid foundation for this exploration. (If you haven’t yet, don’t miss it — it’s packed with insights to kickstart your analytical mindset!).
So, you're diving into the world of correlation and regression analysis — two powerhouse techniques that reveal the relationships in data. Yet, as a beginner, it’s easy to feel lost in the complexity of formulas, coefficients, and technical jargon. If you've ever asked yourself, “How do I actually use these concepts to understand my data?” or “How do I avoid misinterpretation?”, you're not alone. Many budding data scientists struggle with where to start, how to build useful models, and what mistakes to watch for.
This guide will walk you through the essentials of correlation and regression in an approachable, no-nonsense way. By the end, you’ll be able to confidently identify patterns in your data and make predictions that bring real insights. We’ll also tackle common frustrations like understanding when correlation isn’t causation, interpreting model results, and avoiding common pitfalls.
Correlation – Identifying Relationships, Not Causation
What Exactly is Correlation?
For beginners, correlation can feel elusive: it measures how two variables are related, but that doesn’t mean one causes the other to change. Confused? You’re not alone. Many data analysts new to correlation struggle with knowing what insights to trust and when their assumptions could be wrong.
In simple terms:
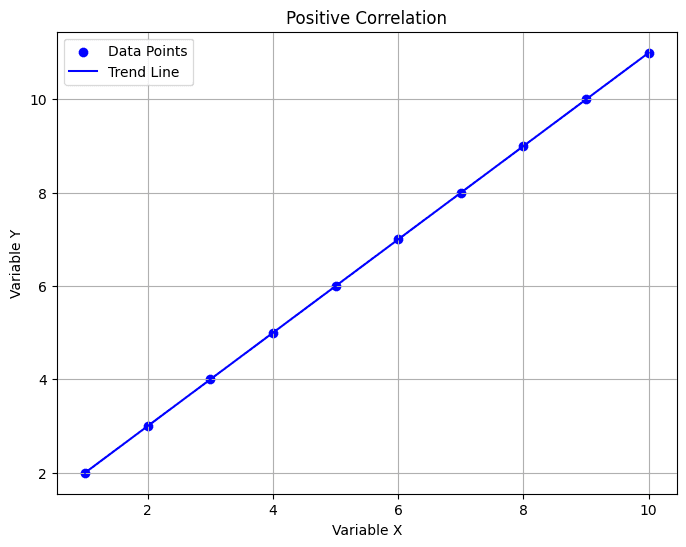
Positive Correlation: Both variables increase together.
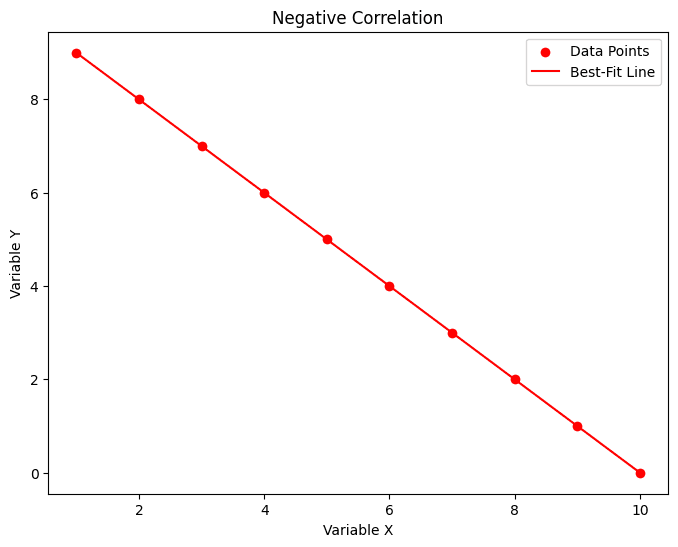
Negative Correlation: As one variable goes up, the other goes down.
No Correlation: No clear relationship exists between the two.
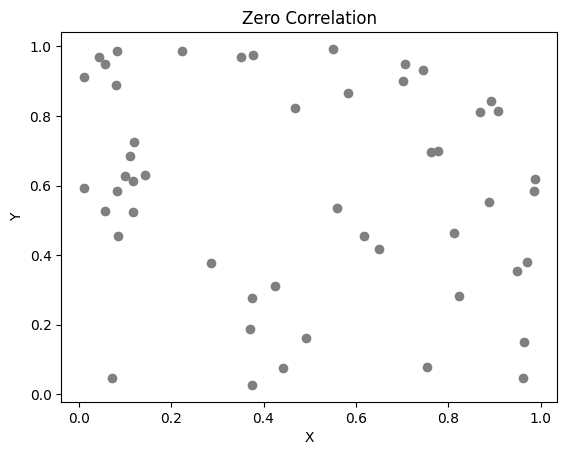
Our examples will show you how to identify each type of correlation and avoid one of the most common mistakes — over-interpreting weak or spurious correlations.
Types of Correlation Coefficients and When to Use Them
Choosing the right correlation coefficient is often a stumbling block. Knowing when to use Pearson (linear) versus Spearman (ranked) or Kendall Tau correlation saves time and prevents frustration. This section will demystify which is best for your data type and use case.
Different scenarios call for different types of correlation coefficients, each suited to particular datasets and research questions:
Pearson Correlation (Linear):
Measures the linear relationship between two continuous variables.
It assesses both the strength and direction of the linear association.
A value of +1 indicates a perfect positive linear correlation, -1 indicates a perfect negative linear correlation, and 0 indicates no linear correlation.
Sensitive to outliers.
Spearman Rank-Order Correlation (Non-Linear):
Effective for data that isn’t strictly linear, as it ranks data instead.
Measures the monotonic association between two ranked variables.# It assesses whether as one variable increases, the other variable tends to increase or decrease, without necessarily# requiring a linear relationship.
Less sensitive to outliers than Pearson correlation because it uses ranks instead of actual values.
Used when variables are ordinal or when the relationship is not strictly linear.
Kendall Tau:
Ideal for small samples, assessing the strength of relationship in ranked data.
Measures the ordinal association between two ranked variables.
It calculates the number of concordant and discordant pairs of data points.
Like Spearman, it is less sensitive to outliers.
Particularly useful when dealing with ties in the data or when the relationship is not strictly linear.

Pitfalls and Misinterpretations in Correlation
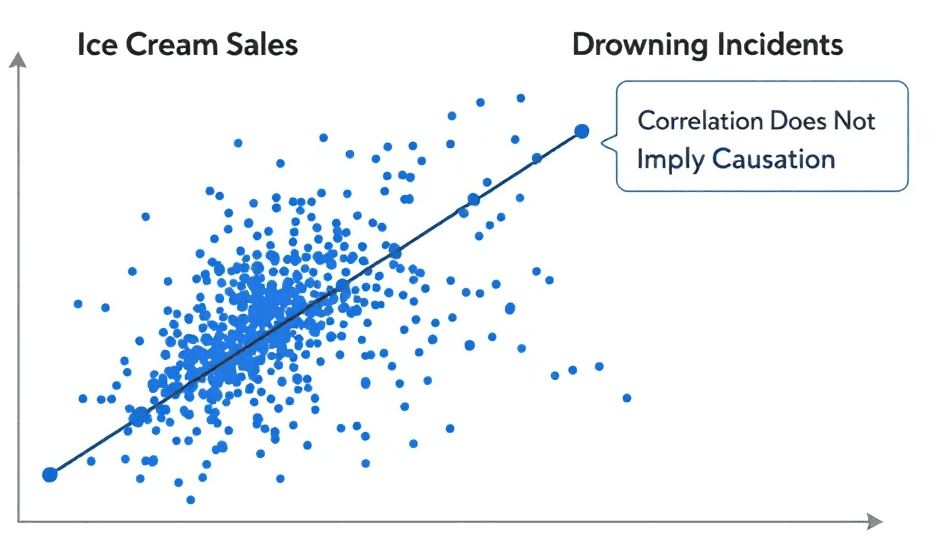
Beware! Correlation doesn’t imply causation. High correlation between two variables doesn’t guarantee that one causes the other, so always consider context. It’s essential to account for factors like spurious correlations, outliers, and confounding variables, which can cloud analysis and mislead conclusions. Here’s where we’ll show you practical techniques to spot and avoid these common pitfalls.
Regression – Moving Beyond Relationship to Prediction
Why Regression? And How Does It Work?
While correlation explains a relationship, regression helps predict one variable based on another — which is vital for decision-making. This is where beginners often feel overwhelmed, wondering, “How can I trust these predictions?” and “What if my data doesn’t fit?”
We’ll start with Simple Linear Regression for single predictor models, then add complexity with Multiple Regression, ideal for real-world scenarios. By the end, you’ll have a clear understanding of how to set up and interpret basic regression models with confidence.
Simple Linear Regression:
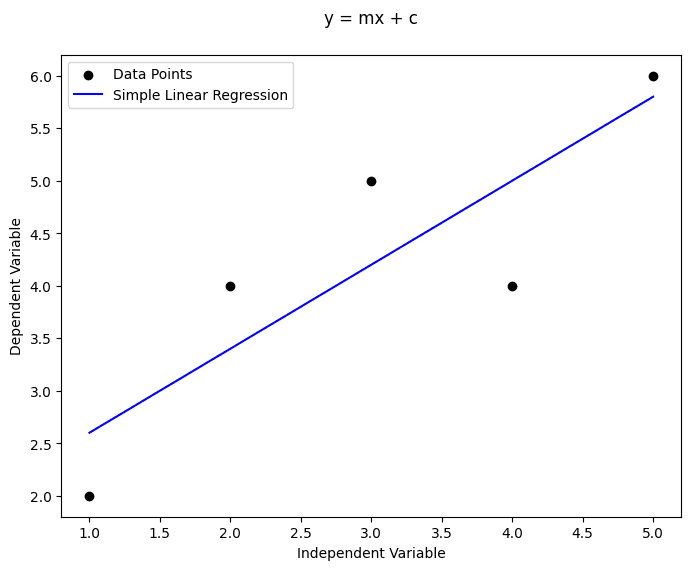
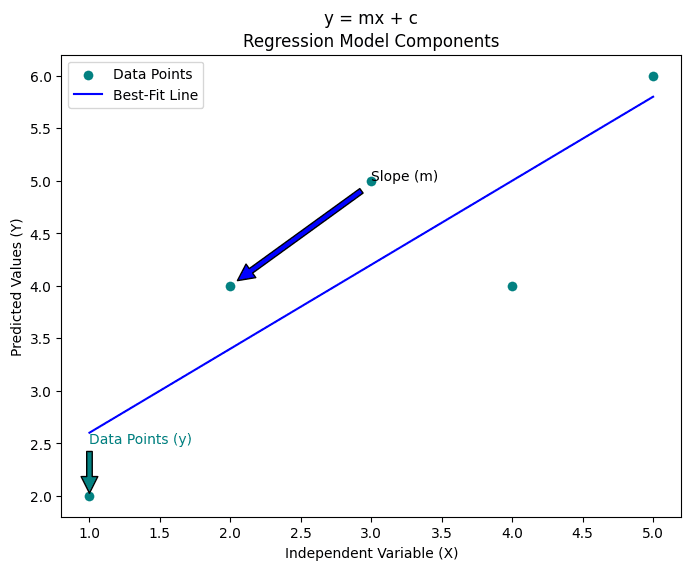
Simple Linear Regression is a statistical method used to model the relationship between a dependent variable 'y' and a single independent variable 'x'. It assumes a linear relationship and aims to find the best-fitting line through the data.
Formula: y = mx + C
Multiple Linear Regression:
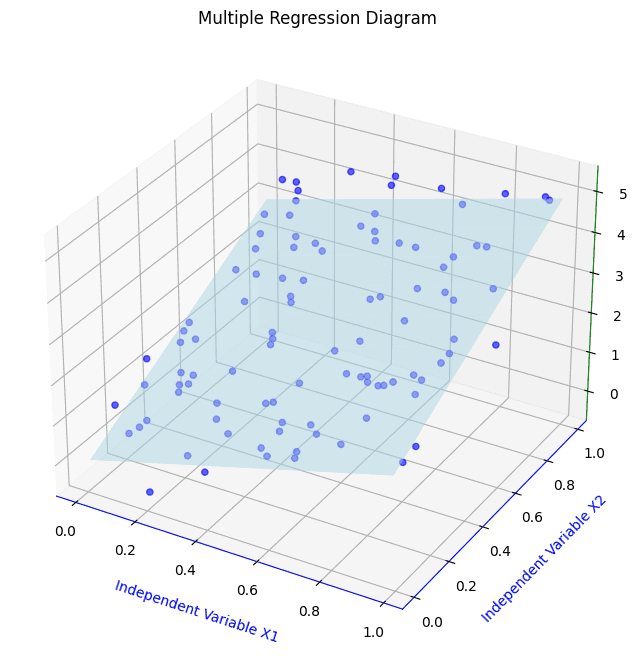
Multiple Linear Regression extends the concept of Simple Linear Regression to multiple independent variables. It models the relationship between a dependent variable 'y' and two or more independent variables ('x1', 'x2', ..., 'xn').
Formula: y = b0 + b1x1 + b2x2 + ...... + bnxn
Building & Interpreting a Regression Model
Interpreting regression models is intimidating for most beginners. Terms like R² (explained variance) and significance testing can feel complex and disconnected from real-world applications. Here, we’ll break down each term in plain language, so you understand how they influence the quality and reliability of your model.
Key topics include:
Coefficient of Determination (R²): Measuring the model’s explanatory power.
Significance Testing: Understanding if results are meaningful or just by chance.
Model Diagnostics: Techniques to handle common issues like multicollinearity, which can skew predictions.
Practical Applications of Regression Analysis
To make it practical, we’ll walk through examples from fields like business forecasting and healthcare analytics, giving you context on how correlation and regression are used to solve real problems. Think: identifying spending trends, predicting patient outcomes, or measuring the impact of marketing campaigns:
Business and Finance: Forecasting sales, identifying customer spending trends.
Medicine and Healthcare: Analyzing patient outcomes based on various treatments.
Social Science Research: Predicting behavioral trends based on demographic factors.
Our examples and case studies will showcase how regression enables businesses to optimize resources, scientists to confirm hypotheses, and analysts to predict outcomes with precision.
Becoming a Data Powerhouse
Mastering correlation and regression doesn’t happen overnight, but with this guide, you’ll feel more confident about identifying patterns, making predictions, and avoiding the missteps that many beginners make. Remember, with the right understanding, these tools open doors to insights that make data meaningful. These techniques are foundational to the field of data science and analytics, offering both beginners and advanced users tools to uncover insights that drive impactful decisions.

What’s Next on the Data Journey?
Stay tuned for our upcoming explorations into confidence intervals, sampling distributions, , and more and don’t hesitate to reach out at info@thedatacell.com. The world of data is constantly evolving, and so are the tools and techniques we use to understand it.