Intro to Hypothesis Testing and Probability Distributions in Data Science: A Foundational Guide

Introduction:
Welcome back to our "Foundations of Statistics" series! Today, we're venturing into essential statistical concepts: hypothesis testing and probability distributions. These topics form the backbone of data analysis and statistical inference, helping us unlock actionable insights from data. If you're just joining, check out our introductory blog for a solid foundation. Now, let’s dive deeper into this journey of statistical discovery.
Hypothesis Testing: A Quest for Statistical Truths
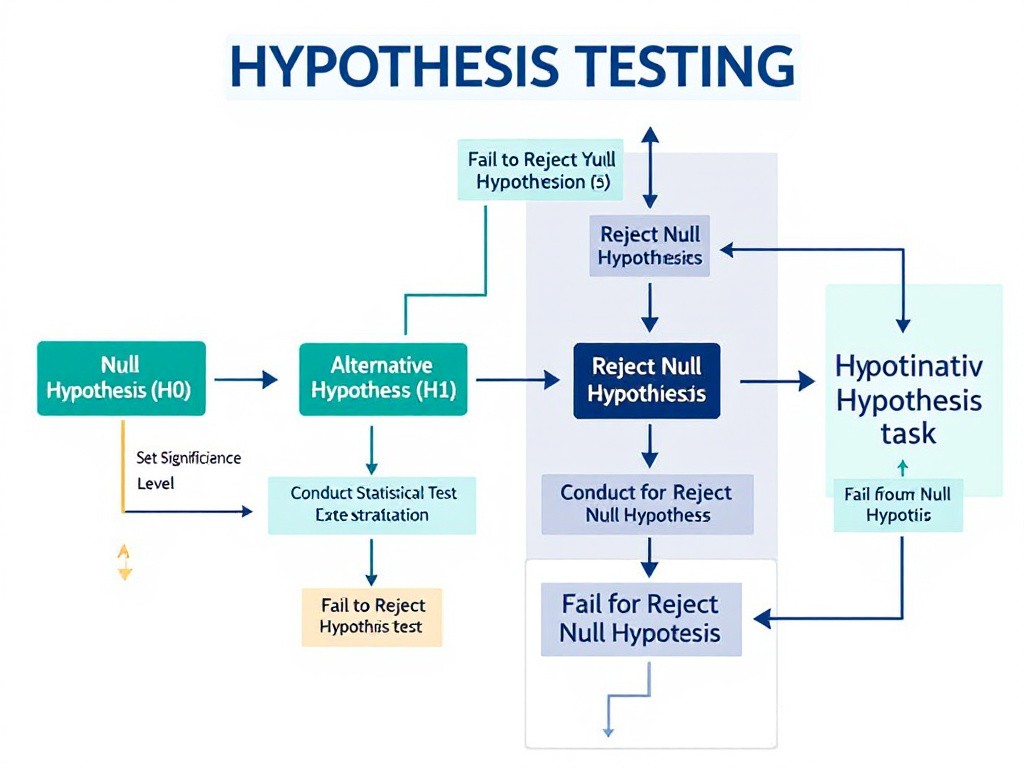
Hypothesis testing helps us make decisions and verify claims based on data. Think of it as a detective's investigation into data-driven mysteries, where we formulate two main hypotheses:
Null Hypothesis (H₀): Assumes no effect or difference in the data.
Alternative Hypothesis (H₁): Challenges the null, suggesting a new discovery or effect.
After setting our hypotheses, we choose a significance level—our threshold for deciding if the data gives enough evidence to reject the null hypothesis. This process guides us in drawing objective, data-driven conclusions.

Our next step is to use statistical tests. In future posts, we’ll cover specific tests like t-tests and ANOVA in detail. These tests examine our data, determining if observed patterns are due to chance or a real effect.
After testing, we interpret results using p-values and confidence intervals. Deciphering these insights is like uncovering secrets hidden in the data, revealing meaningful patterns and truths.
Probability Distributions: Mapping the Data Landscape

Probability distributions describe the possible outcomes in a data set. Imagine data as a vast landscape, and probability distributions as maps guiding us through it. We’ll cover two main types:
Discrete Distributions: These distributions count individual data points, giving precise probabilities for outcomes (e.g., coin tosses, event counts).
Continuous Distributions: These distributions use curves to describe probabilities, painting smooth probability landscapes (e.g., the bell-shaped normal distribution).
Characteristics and Properties:
Every probability distribution has unique properties defined by its parameters. These determine the distribution's shape, center, and spread, allowing us to understand the data's structure.
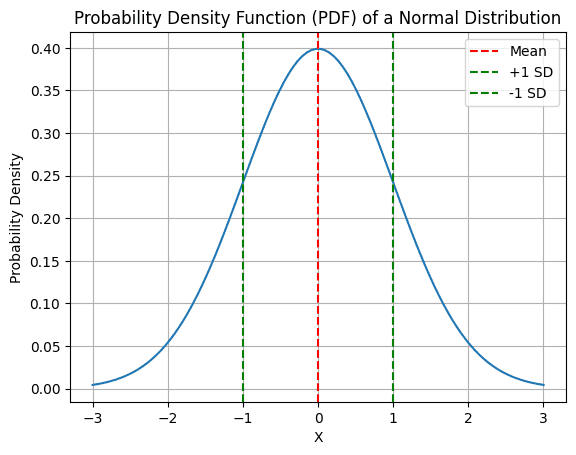
Probability Density Function (PDF):
The Probability Density Function (PDF) offers insights into the likelihood of specific values within a continuous distribution, often represented as a smooth bell curve in normal distributions.

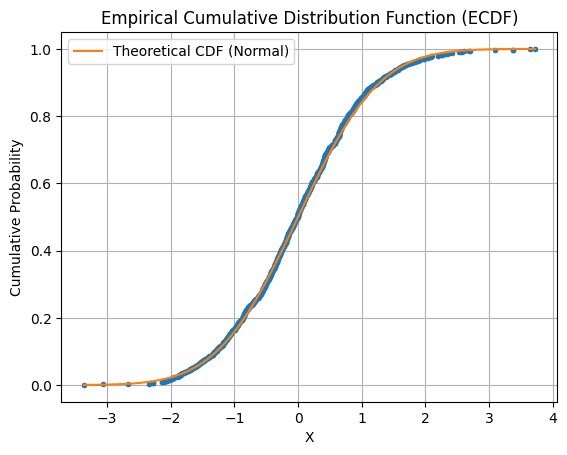
Cumulative Distribution Function (CDF):
The Cumulative Distribution Function (CDF) takes on a recognizable sigmoid or "S-shaped" curve, especially in the context of normal distributions. This curve gradually rises as it accumulates probabilities, providing a clear, cumulative roadmap through the data’s distribution.

PDFs and CDFs are essential tools, guiding us through probability distributions and helping us interpret data trends.
Real-World Applications of Probability Distributions
Probability distributions are powerful tools with practical applications across industries.
In finance, they model stock market movements, informing investment strategies.
In biology, they predict genetic inheritance patterns.
In engineering, they simulate system behavior, guiding design decisions.
These distributions transform raw data into insights that drive innovations, strategies, and predictions across fields.

Prepare for Our Next Adventure!
As we continue our journey into statistics, probability distributions and hypothesis testing are crucial stepping stones. Stay tuned for our next blog, where we’ll dive into data patterns with regression and correlation to reveal hidden relationships within data.
Subscribe Below to join us on this data-driven adventure! Share your thoughts or questions in the comments and let’s keep exploring statistical wonders together.