Unveiling the Power of ANOVA: A Journey from Probability to Machine Learning

Unleashing the Power of ANOVA for Data-Driven Insights
In the expansive world of data science, insights often lie hidden within layers of complex data. To uncover these, having the right statistical tools is essential, and ANOVA (Analysis of Variance) stands out as a powerful yet often underutilized method. This guide explores ANOVA in depth, connecting it to probability, advanced statistical analysis, and machine learning—creating a foundation for precise and meaningful data-driven decisions.

The Essence of ANOVA: Dissecting Variability with Precision
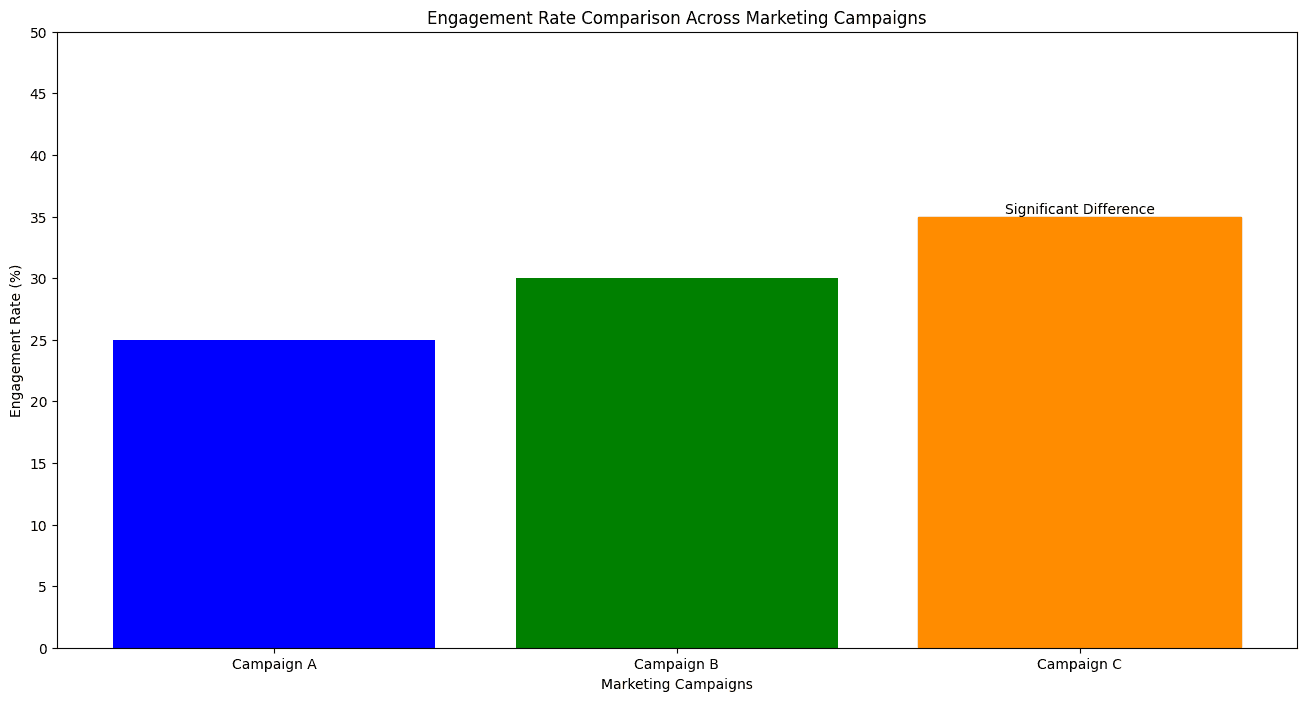
Imagine you’re a data analyst tasked with evaluating how three different marketing campaigns impacted user engagement on a platform. How do you determine if one campaign significantly outperformed the others? Enter ANOVA, a statistical test that compares the means of multiple groups, dissecting dataset variability to highlight statistically significant differences.
ANOVA allows data scientists to determine if observed variations are due to specific conditions or simply random chance. Think of it as separating the "signal" (true difference) from the "noise" (random variation) in datasets, whether it's for hypothesis testing, feature engineering, or predictive modeling in data science projects.

The Statistical Core of ANOVA: Probability, Hypothesis Testing, and Variance Analysis
In data analysis, understanding core statistical principles is critical for interpreting data accurately. Here’s a breakdown of key ANOVA-related concepts:
Probability: This underpins ANOVA by assessing the likelihood that any differences are due to chance. For new learners, probability may seem abstract, but it’s crucial. Think of probability as the chance that an observed result could occur by random chance. In testing ad campaign effectiveness, probability helps determine if click differences reflect actual performance or random fluctuations.
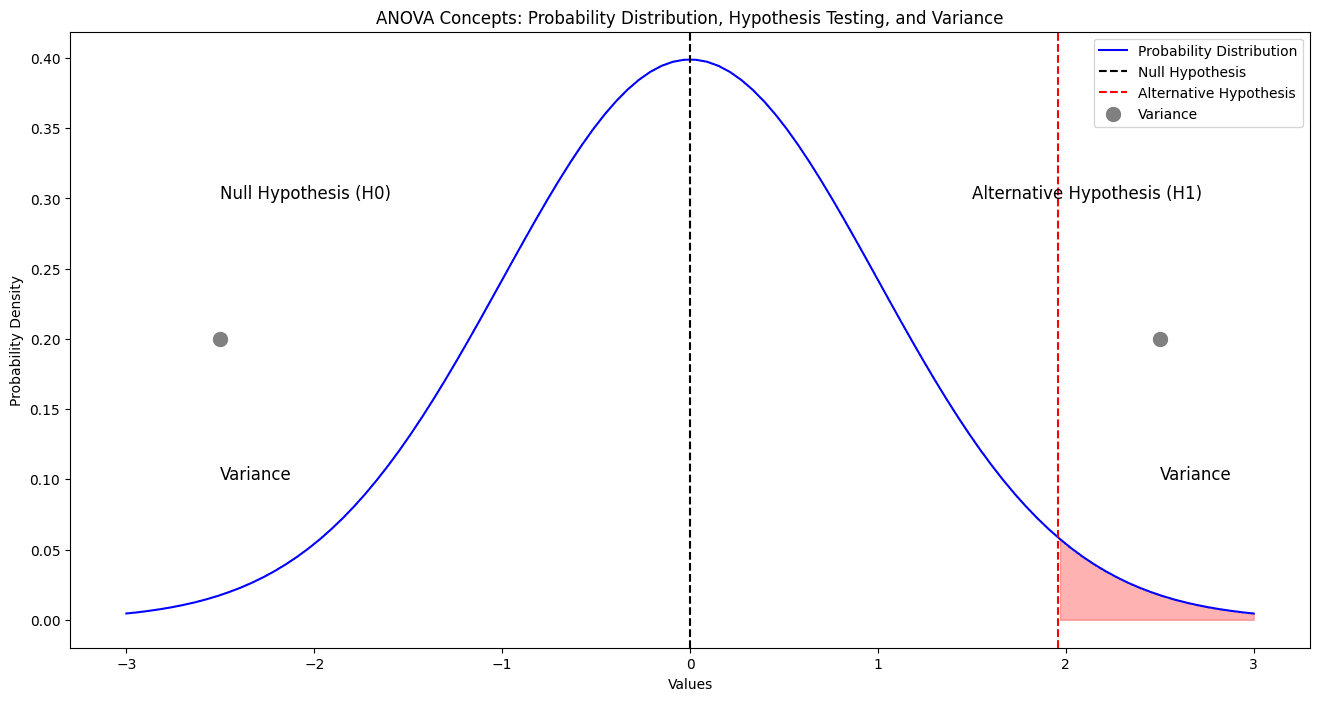
Hypothesis Testing and p-values: ANOVA begins with setting up a null hypothesis (no difference among groups) and an alternative hypothesis (a difference exists). Hypothesis testing offers a structure for comparing multiple groups, while the p-value aids in deciding whether to reject the null hypothesis. A p-value under 0.05 suggests statistical significance, indicating that observed data differences likely aren’t due to chance alone.
Variance Analysis: ANOVA focuses on analyzing variance—the measure of how data points differ from the mean. In an ANOVA test, the data variance is separated into two parts: between-group variance (differences between each group mean) and within-group variance (differences within each group). This separation allows us to determine if mean differences between groups are greater than the random variation within groups, helping us pinpoint significant effects in experiments or A/B tests.
Key Takeaway: Variance analysis allows us to determine if the difference between group means is due to genuine effects rather than random variation.

Types of ANOVA: Selecting the Right Model for Your Data
To apply ANOVA effectively, you need to choose the appropriate ANOVA type. Here are the main types, each tailored for specific scenarios in data analysis:
One-Way ANOVA: Best for testing one independent variable across multiple levels or groups. Suppose we want to test if different ad platforms (like social media, email, and paid search) have distinct effects on click-through rates. One-Way ANOVA helps determine if any significant differences exist across these categories by comparing the mean click-through rate for each platform.
Two-Way ANOVA: When analyzing two independent variables simultaneously, Two-Way ANOVA provides insights into both individual and interactive effects. Imagine testing the impact of different campaign themes (like product-focused vs. lifestyle) across multiple age groups. Two-Way ANOVA can reveal not only whether theme or age group impacts engagement but also whether the combination has a unique effect.
Repeated Measures ANOVA: Useful for analyzing data where the same subjects are tested across multiple conditions. For example, if you want to test user satisfaction over several time points after a website update, Repeated Measures ANOVA will show if satisfaction significantly changes over time for the same users.

Step-by-Step Guide to Conducting ANOVA
Conducting an ANOVA can seem overwhelming, but breaking it down makes it manageable. Here’s a simplified approach:
Formulate Hypotheses: Set up your null hypothesis (no significant difference) and alternative hypothesis (a difference exists). Let’s say you’re comparing conversion rates across three different landing pages. Your null hypothesis would state that conversion rates are equal across all pages.
Collect and Organize Data: Your data needs to meet certain ANOVA assumptions, such as normal distribution and equal variances across groups. This data quality step ensures reliability in the ANOVA test, which compares within-group variance (random fluctuations within each group) to between-group variance (differences between each group’s mean).
Calculate Variances: Using statistical software (e.g., Python’s SciPy or R), calculate both within-group and between-group variances. The goal is to understand whether differences in means across groups are due to real effects or just noise.
Compute the F-Statistic and p-value: The F-statistic quantifies whether the between-group variance significantly exceeds the within-group variance. A low p-value confirms statistical significance, indicating you can reject the null hypothesis with confidence.
Interpret Results: Analyzing the p-value and F-statistic can confirm if the differences observed are meaningful. For instance, if testing ad types, a low p-value could suggest certain ads perform significantly better, guiding your future marketing strategies.
Real-World Applications of ANOVA in Data Science, Healthcare, Business, and More
Here’s how ANOVA translates into actionable insights across diverse industries:
Healthcare: In clinical trials, ANOVA helps test treatment efficacy across patient groups, critical for making informed medical decisions. ANOVA enables researchers to determine if new drug treatments significantly differ in efficacy across demographics.
Business and Marketing: Businesses use ANOVA for A/B testing and campaign analysis, optimizing return on investment (ROI) by identifying high-performing strategies. Whether testing ad platforms or sales tactics, ANOVA pinpoints the most impactful methods for audience engagement.
Key Insight: ANOVA’s ability to detect significant differences makes it invaluable across industries—from healthcare to marketing.

ANOVA as a Data Scientist’s Essential Tool

ANOVA stands as one of the most transformative tools in the data analyst’s toolkit, enabling precision in distinguishing meaningful data differences from mere randomness. Whether it’s enhancing clinical trial accuracy, optimizing marketing strategies, or fine-tuning business decisions, ANOVA empowers us to leverage data effectively, making informed and statistically sound conclusions. By unraveling hidden patterns and relationships, ANOVA allows data scientists and analysts to elevate their data insights, driving impactful, evidence-backed strategies that align closely with organizational and business goals. Embracing ANOVA as a core analysis method not only hones analytical skills but also deepens our ability to interpret and act on complex data structures.
Master ANOVA and Elevate Your Analytical Skills!

Ready to harness the full potential of ANOVA in your data journey? Dive deeper into the fundamentals, explore practical applications, and integrate ANOVA into your skillset to elevate your data-driven decision-making. Check out our free resources, and subscribe for access to upcoming resources and insights on using statistics and machine learning to make a lasting impact!